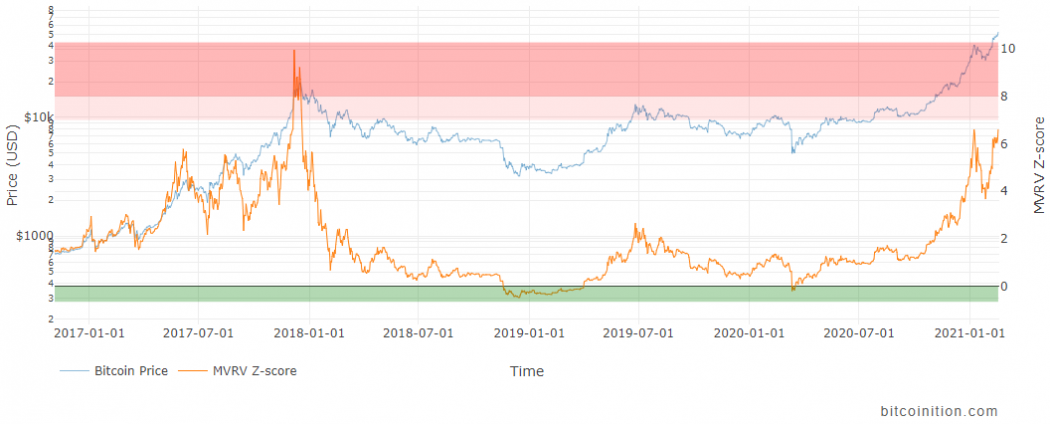
Bitcoin just hit a new high, passing $56,000, and its market cap went above $1 trillion. So how does it compare if we look back at the previous peak in 2017?
The MVRV Z-score is now at it highest level (6.6) since 2017, but not yet in the “red zone”. In 2017, even if we ignore the two smaller peaks of the MVRV Z-score, the price almost doubled from the value of 6.6, in May 2017, to the top, 6 months later in December.
If we look at the Google Trends between 2013 and 2017, the interest in “Bitcoin” during the peak of 2017 was much higher than during the previous peak of interest of 2013. It was topped in June 2017, again, 6 months before the peak.
If we compare it with the situation now, the previous peak of interest has not been reached yet, which indicates that mainstream attention is not yet important enough to fuel a bubble. However, it shows that we are deep in a bull run and that the price top is approaching.
Both MVRV Z-score and public interest indicate that we may be 6 months away from the top, with a potential 100% incease in price. That is, if the market behaves like in 2017, which is far from guaranteed.
