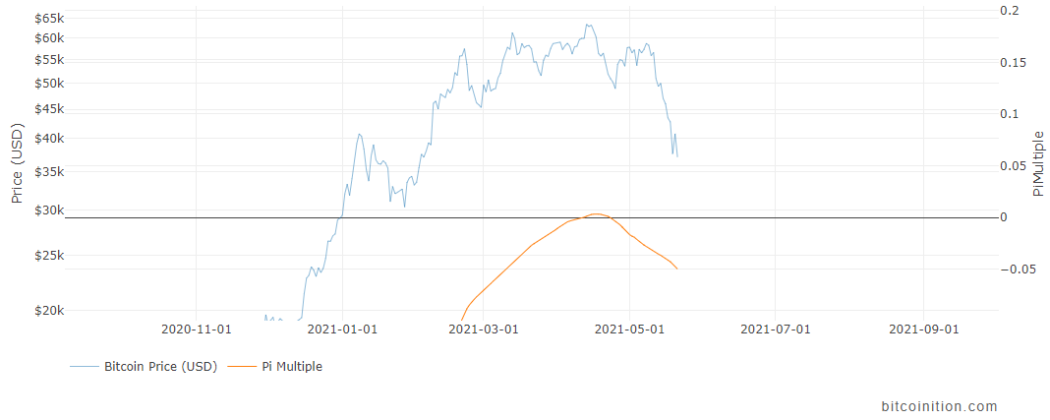
First let’s be clear: nobody knows if we have passed the top of the bull market, and those who pretend they do are liars or delusional. But we can suppose the bull market is not over. Let’s have a look at our charts to guess what to do.
The Pi Multiple has been remarkably accurate to identify this (local ?) top. It crossed the zero line one day before the price reached a top. However, this might just be a coincidence. There is nothing really supporting the idea that a ratio close to Pi is magically correlated to Bitcoin cycles.
The Mayer Multiple shows that we reached the value of 2.4 twice a few weeks before the top. As we already explained, this indicator is best suited for timing market entry, but it still shows that the price is unusually high.
The MVRV Z-score, which is arguably a better indicator since it looks at on-chain data, shows that we reached a very high value.
Finally, we can compare with previous macro cycles and try to figure where we are. The Post-Halving Channel and Bull Market Comparison are here to help.
From these charts, we can guess that we are still on track, very early in the cycle, and the price did not go parabolic as with previous tops. The situation is not even similar to the first 2013 top, which printed a real spike. The hill on which we are now it rather smooth and does not look like the crazy irrational trading of previous tops.
