.
.
Bitcoin CHARTS
The best charts selected to help you understand market cycles and have as much information as possible if you decide to invest in Bitcoin.
Free and clear information. Updated daily.
View Charts
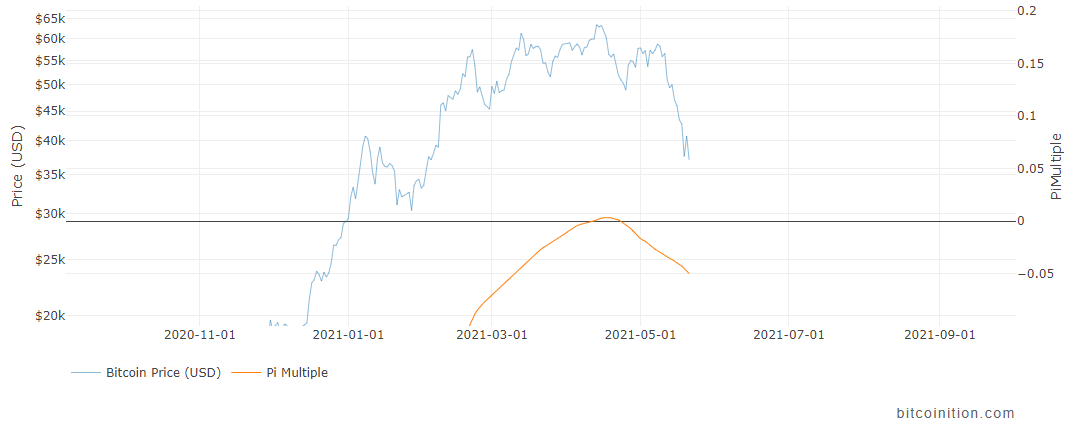
Was that the top?
First let’s be clear: nobody knows if we have passed the top of the bull market, and those who pretend…
2021-05-23
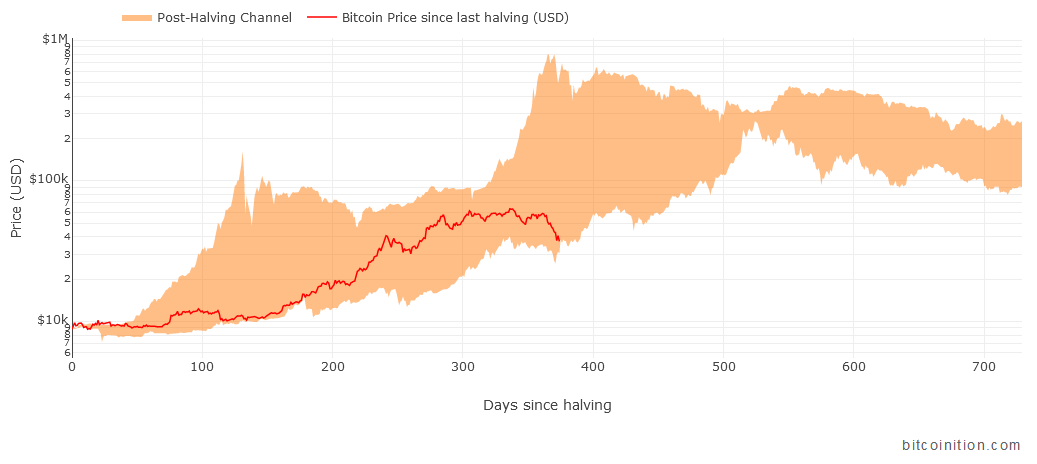
New Bitcoin charts : Post-Halving Channel & Bull Market Comparison
We added two new Bitcoin charts this week. The first is the Post-Halving Channel. It shows the range of Bitcoin…
2021-05-22
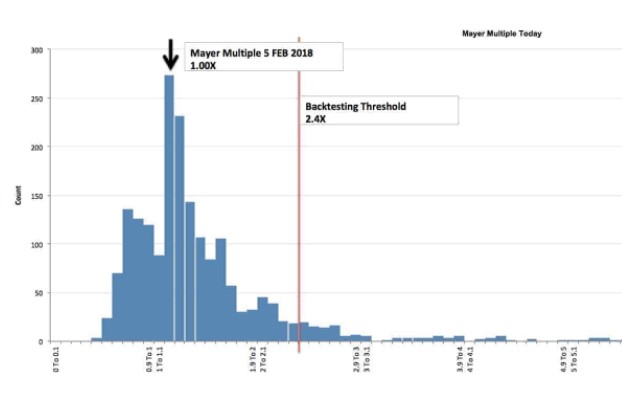
How to use the Mayer Multiple
There seem to be a lot of confusion around the Mayer Multiple. A short explanation is in order.…
2021-02-22
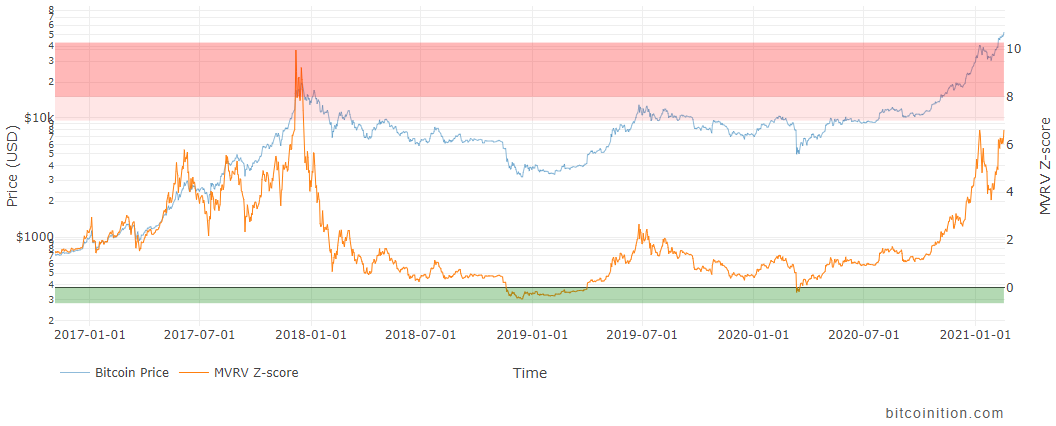
Bull Run Update
Bitcoin just hit a new high, passing $56,000, and its market cap went above $1 trillion. So how does it…
2021-02-19
Easily accessible JSON API to build your own apps.
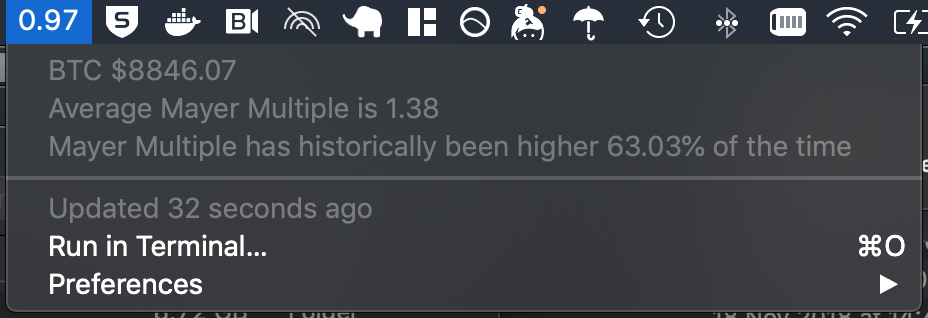
Data from all charts can be retrieved from this API, including the lastest Mayer Multiple and MVRV Z-score.
The example shown here was developped for xbar by Tadek Teleżyński.
JSON API
